The Digital Researcher Lab is a virtual space that showcases projects using data visualisation and analysis tools. Use this page to get ideas on how to present and share your research, find the right tool, get training, or organise a consultation.
From small experiments to big data, the possibilities for researchers are endless.
Tools and training
Explore the tools and training options to help you create, interpret, and enhance your data.
 Access and interpret text and produce quantitative data for analysis.
 Create visual representations using Venngage and Voyant Tools.
Geographical Information Systems
 Capture, analyse and present spatial or geographical data using OpenStreetMap or QGIS.
 Learn how to design and create media using Adobe Creative Suite.
 Analyse your data using in different ways to answer your research question.
 Create models using 3D modelling software and photogrammetry tools.
Training
Consultation
Email our technology team at training@library.uq.edu.au to find out more about data analysis and visualisation tools, or how we can help you with your project.
Join a community of practice
- Hacky Hour – every Tuesday, 3-4 pm
- UQ R User Group (UQRUG) – last Wednesday of the month, 12-2 pm; or on Chat.UQ
- UQ Geospatial Analysis Community – email uqgeo.community@gmail.com, for information
- University of Queensland Computing Society (UQCS)
Learn about open research software
Visualisations of large datasets
Users of the page can select the map pins (data points), download datasets and discover more about the research and reef conservation.
The open access datasets are stored in UQ eSpace. The Digital Researcher Lab supported the UQ Global Change Institute in the design and presentation of the visualisation.
Visualisations using digital collections
Quick examples of visualisations using different tools and methods that we support.
Text analysis: the work of Professor Dorothy Hill
Professor Dorothy Hill was a prolific geologist and palaeontologist whose research predominantly focused on Palaeozoic corals. This project uses NVivo (qualitative analysis software) to analyse two key texts of Professor Hill's: her PhD thesis, written in 1932 and "The Geology of Queensland" first published in 1960.
Analysis: thematic and term frequency
NVivo enables thematic analysis and term frequency within the text. It also shows similar sentiment typical in both publications, even though they were written almost thirty years apart.
Presentation and visualisation of data
The NVivo analysis is presented in an online PowerPoint show. The presentation uses separate tabs to represent different areas of her academic writing.
View the online presentation
Click through the presentation at your own pace to see how thematic patterns in the text have been presented.
For the best viewing experience: open click the Open in New Window button on the PowerPoint and then Start Slide Show to view the presentation in fullscreen.
Cleaning optical character recognition (OCR) data with OpenRefine
OpenRefine was used to clean up a dataset of more than 20,000 entries from the Rolls of the Board of Architects of Queensland (a UQ Library collection in UQ eSpace). The dataset contains searchable documents of digitised material and output files of Rolls of the Board (1930-1980); Removals from the Register of Architects (1964-1980); and Lists of approved Architectural Companies in Queensland (1973-1980).
Although some cleaning was undertaken, the OCR applied during the digitisation process returned a low accuracy rate for some of the text. OpenRefine was used to:
- Cluster and fix variations of the same name
- Parse dates with inconsistent formatting
- Remove rogue characters that were inserted by the OCR process
- Convert data to the correct data type to facilitate exploration
- Join duplicated columns
- Populate coordinates from the addresses using an external API (Nominatim) and query the OpenStreetMap database
- Format the data in a readable way.
Even though OpenRefine allows automated and semi-automated cleaning tasks, issues remain and some OCR'd text is not recoverable without cross-checking with the original document. However, the tool saved many hours of laborious work, can be used to investigate potential further refinements, and facilitates reconciling and augmenting the data.
Explore before and after views of the data
Drag the scroll bar (moves up and down) to view how the data has changed. The top of the image is the "Before" version, the bottom is the "After" version.
Before version: Date or Registration column had inconsistent date formatting.
After version:
- Year has been separated into its own column
- Date of registration has been consistently formatted (Year - Month - Day).
3D modelling: interacting with objects in space
Using technologies such as geographic information systems (GIS) and photogrammetry, you can analyse and display elements of your research as an alternative to points on a map or static image.
Geographic information systems (GIS)
By recording positions in a GIS you can interpret spatial data. This enables relationships between elements to be analysed for patterns.
Photogrammetry
By recording your research subjects or environments, you create comprehensive measurements, dimensions and textures. These combine to produce a highly detailed 3D model which allows for greater digital interaction with the object and 3D printing.
3D models of grotesques around the Great Court
In this example, several of the grotesques in the Great Court, which are situated on the cloisters, were accessed on an elevated platform and photographed multiple times from all angles. These images were then processed using photogrammetry software to produce the final 3D images.
The position of each of the grotesques is indicated on uMap (an open source, online geographic information system). Click the icons on the map to view the related 3D model.
3D models of grotesques, and their approximate locations, include:
- Professor Dorothy Hill (Richards Building)
- Dr Rhyl Hinwood (Goddard Building)
- The Crane Driver (Forgan Smith Building)
- John Theodore Muller (Forgan Smith Building).
Text analysis: Gale Digital Scholar Lab
Users can analyse and interrogate textual data with the text analysis and visualisation tools built into the Gale Digital Scholar Lab. Upload and analyse your own data sets, or search the Gale Archives to build content sets of up to 10,000 documents.
Text analysis methods include: Named Entity Recognition, Topic Modelling, Parts of Speech tagging, and more.
This visualisation was created using the Topic Modelling analysis tool within the Gale database.
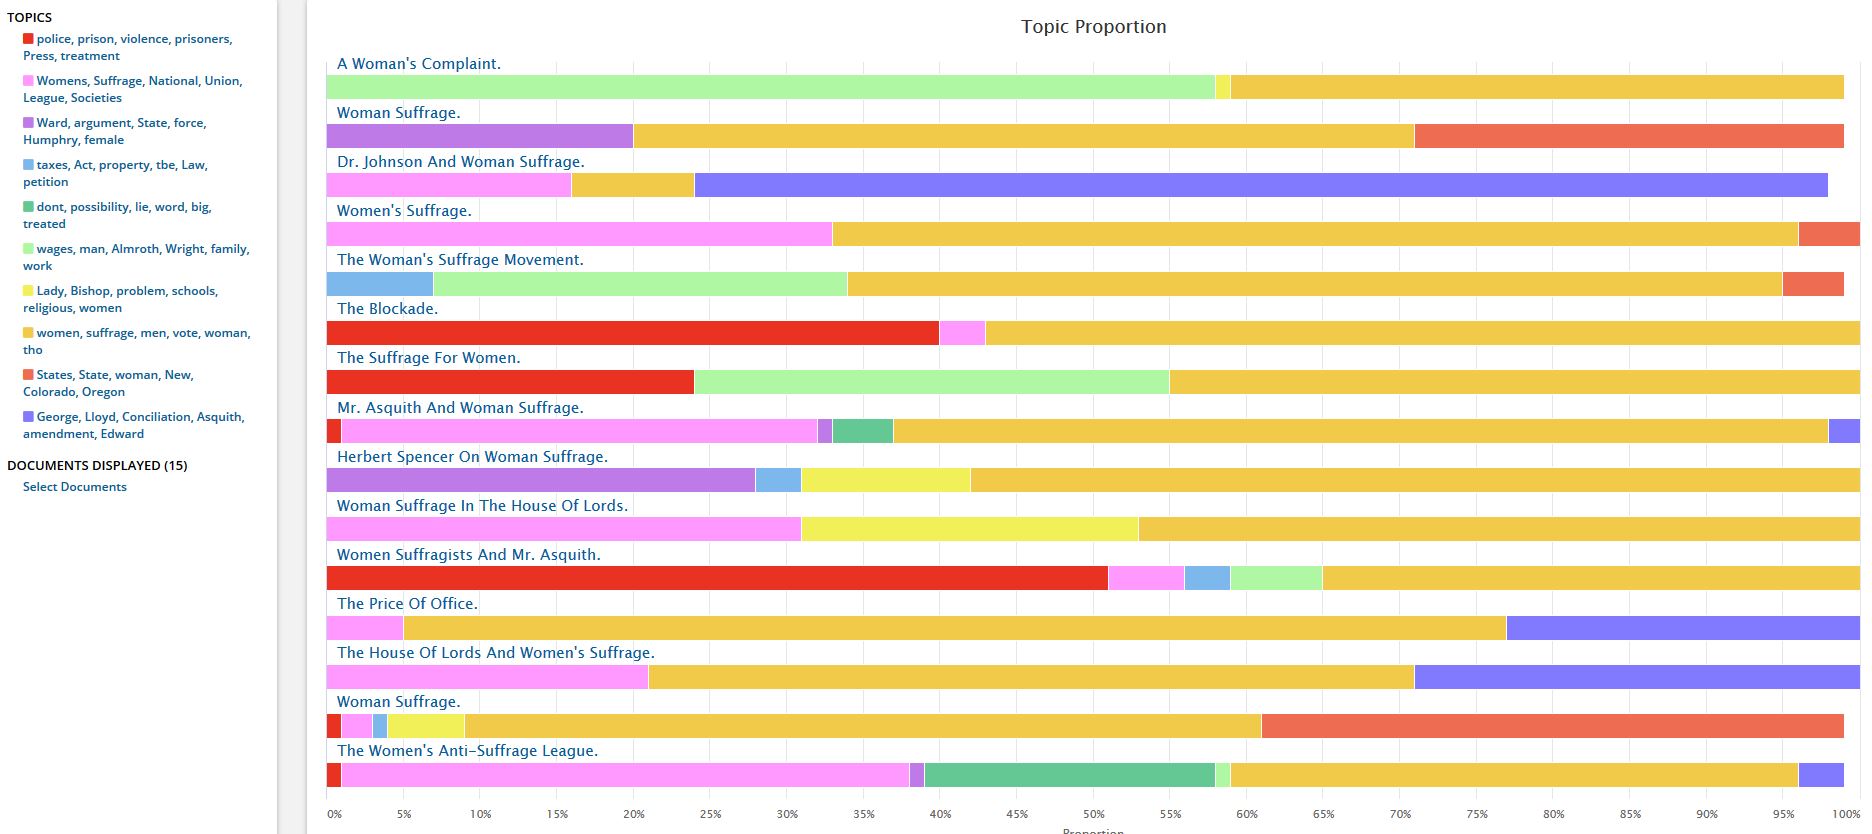
Sub themes are colour coded and described using stacked bar charts.
Using the topic modelling tool
Topic models provide a simple way to analyse large volumes of unlabelled text. A "topic" consists of a cluster of words that frequently occur together. Using contextual clues, topic models can connect words with similar meanings and distinguish between uses of words with multiple meanings.
The Digital Scholar Lab breaks the analysis process down into three steps:
-
Build your content/data set.
This example uses a content set created via a keyword search of the Times Digital Archive (a Gale Archive) for “women’s suffrage” in letters to the editor between 1880-1920. -
Clean your data.
Using the in-built cleaning tools, you can use the default cleaning set-up or create your own. E.g. remove stop words, punctuation and special characters from the data set. -
Analyse the clean data using the in-built tools.
The tool set-up allows some control of the built-in tools, e.g. this example is set to identify six words per topic and 10 topic clusters.
Try it yourself
Use these instructions to replicate the visualisation used in this example. Or go to Gale Digital Scholar Lab to create your own.
Mapping: exploring water themed building names in Kurilpa using GIS and R
A Geographic Information System (GIS) integrates hardware, software and data to capture, manage, analyse and display all forms of spatial data and imagery. GIS can be used to support decision making, in addition to visualising spatial data. Common types of analysis include:
- Location, quantity and density of features
- Spatial relationships and patterns
- Temporal change.
The map
The map highlights buildings with water themed names across multiple languages in the the West End area in Brisbane.
The underlying data is sourced from the OpenStreetMap database, cleaned and transformed using an R script, and presented on a map using QGIS.
The R programming language enables an automated and reproducible process to refine the raw OpenStreetMap data. A GIS tool such as QGIS makes it possible to fine tune the rendering of the data and the composition of the final map.
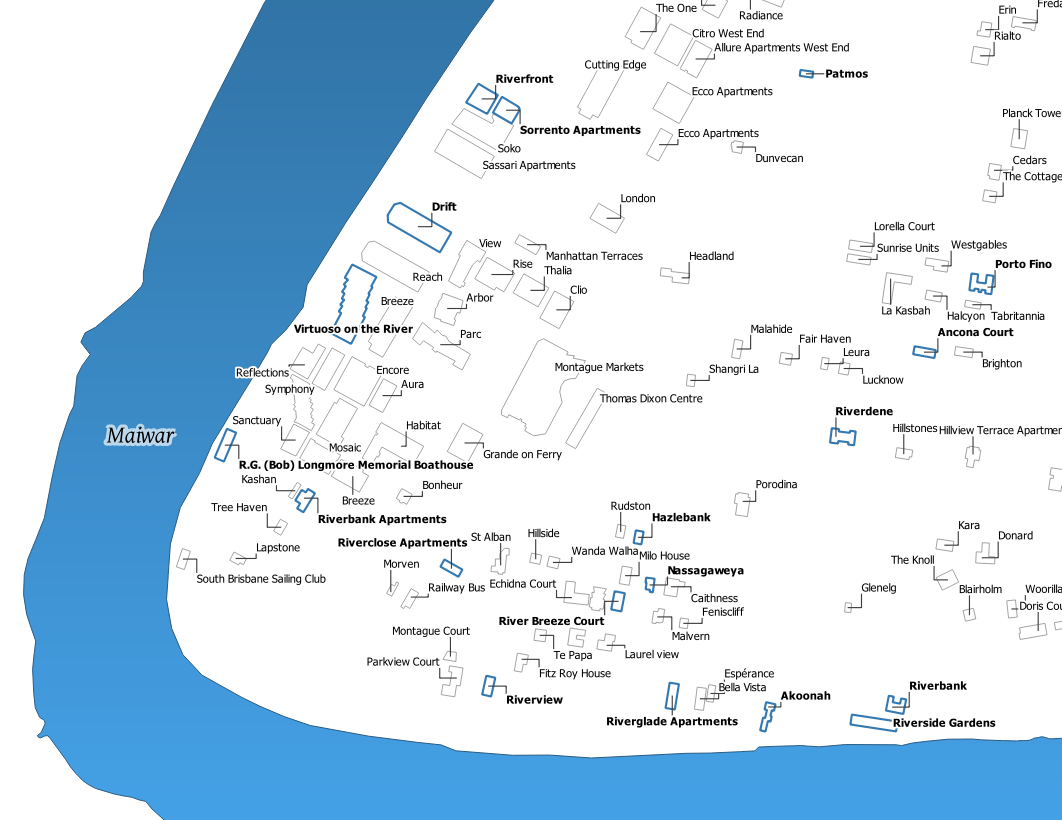
Kurilpa (located in West End and South Brisbane), is a significant meeting place for the Turrbal and Yuggera peoples and means "the place of the water rat". Note: previously thought to refer to a water rat species; however, ongoing research indicates this to be incorrect. (State Library Queensland).
Maiwar being the widely used and an accepted word by both Yuggera and Turrbal people for river.
Download Water themed building names to view a detailed version of the map.
Water themes
Many building names in this region have a (perceived) water theme.
References from Greek and Italian heritage includes:
- Ancona: port in Italy
- Sorrento: coastal town in Italy
- Patmos, Kos and Kalymnos: Greek islands
- Smyrna: ancient Greek port city.
Other building names are a testimony of the cultural
diversity of the area:
- Nassagaweya: a town in Ontario, derived from the Mississauga word nazhesahgewayyong, "river with two outlets"
- Soko: Fijian for "cruise", "voyage" or "to sail"
- Drayton: possibly from Old English draeg for "slipway"
- Dauphin: "dolphin" in French (on street of the same name)
- Gwylan: "seagull" in Welsh.
Find out more about using the library's collections and datasets as an experiment or research project. Contact us through AskUs.